Financial Information
- Consolidated financial
- Separate financial
- Stability Index
- Profitability Index
- Growth/Activity Index

-
(Unit : One million won) Division 2023 2024 2025 Current assets 1,745,855 2,090,596 2,209,480 Quick asset 1,069,300 1,157,026 1,304,967 Inventory asset 676,555 933,570 904,513 Noncurrent asset 3,315,102 3,331,956 3,402,431 Investment assets 251,928 178,096 184,388 Property, Plant and Equipment 2,736,769 2,823,271 2,857,178 Right of use asset 47,087 48,412 48,072 Intangible assets 63,111 59,598 91,385 Other noncurrent asset 216,207 222,579 221,408
Total assets
-
Total shareholder's Equity

(Unit : One million won) Division 2023 2024 2025 Capital 28,572 28,572 28,572 Share Premium 149,481 149,481 49,481 Accumulated other comprehensive income 23,782 55,915 77,591 Other Reserves -6,524 -11,506 11,748 Retained earnings 971,596 1,042,930 1,227,584 Non-controlling interests 1,064,699 1,159,789 1,235,383 -
Total liabilities
(Unit : One million won) Division 2023 2024 2025 Current liabilities 1,451,194 1,555,103 1,353,241 Noncurrent liabilities 1,378,157 1,442,267 1,628,310
-
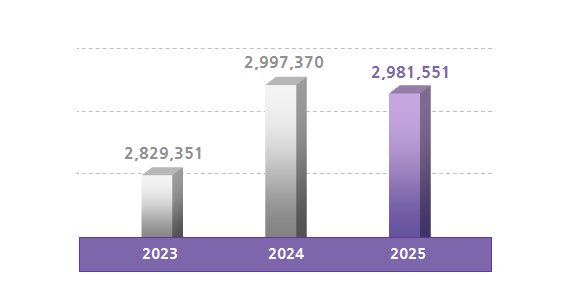
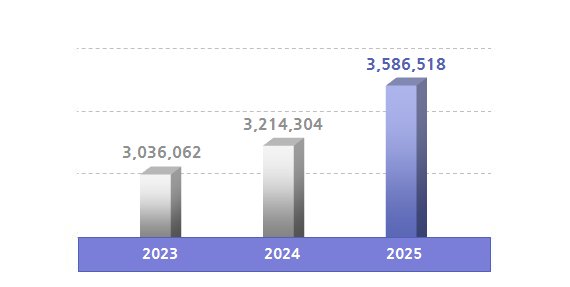
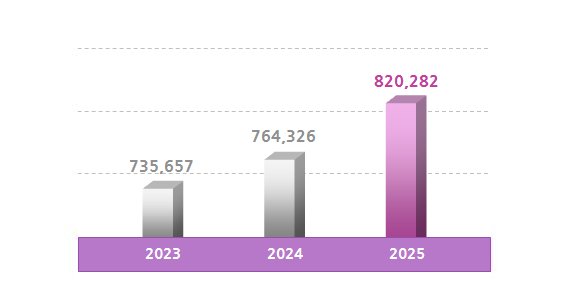
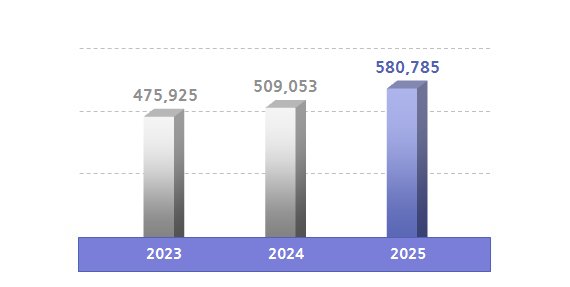
Sales
-
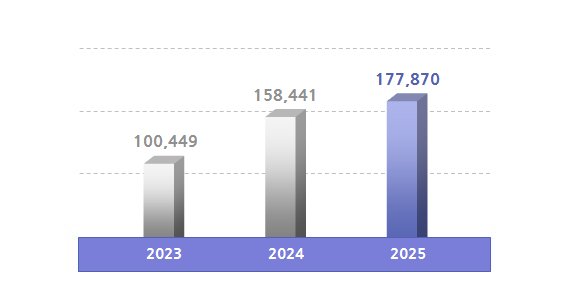
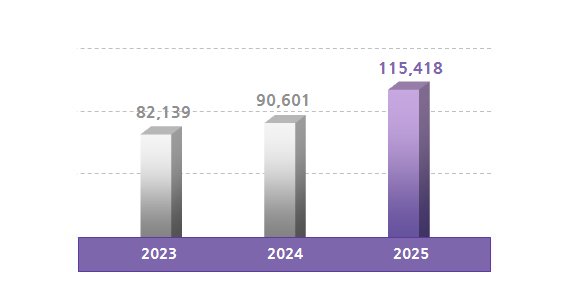
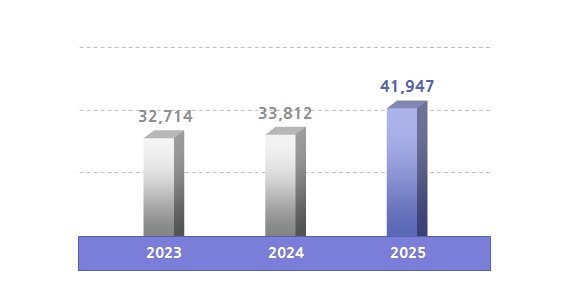
Net income
-
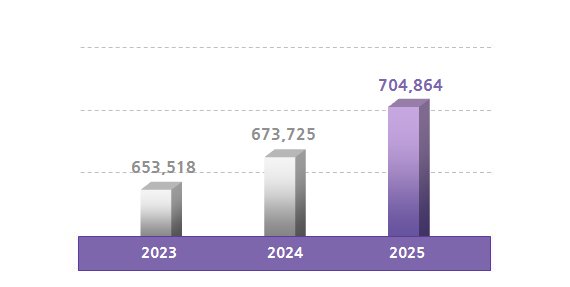
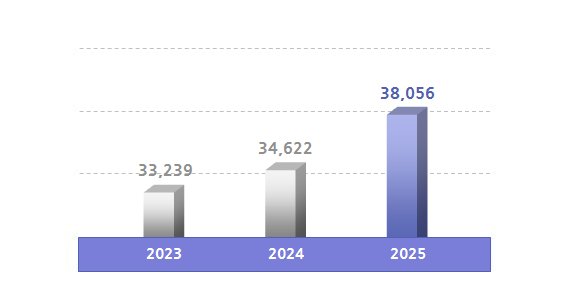
Operating income
-
(Unit : One million won) Division 2023 2024 2025 Current assets 154,594 184,873 202,702 Quick asset 130,402 159,517 176,683 Inventory asset 24,192 25,356 26,019 Noncurrent asset 581,063 579,453 617,580 Investment assets 426,422 427,131 457,402 Property, Plant and Equipment 137,149 135,752 138,065 Right of use asset 1,575 3,305 6,743 Intangible assets 4,621 5,165 5,131 Other noncurrent asset 11,296 8,100 10,239
Total assets
-
Total shareholder's Equity
(Unit : One million won) Division 2023 2024 2025 Capital 28,572 28,572 28,572 Capital surplus 149,481 149,481 49,481 Capital adjustments 651 -400 -843 Accumulated other comprehensive income -19,344 -24,327 -22,803 Retained earnings 494,158 520,398 650,456 -
Total liabilities
(Unit : One million won) Division 2023 2024 2025 Current liabilities 64,163 72,799 72,494 Noncurrent liabilities 17,976 17,802 42,924
-
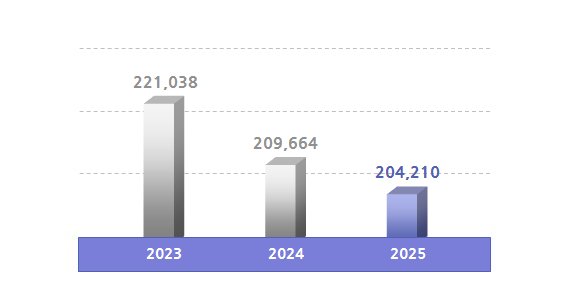
Sales
-
Net income
-
Operating income
-
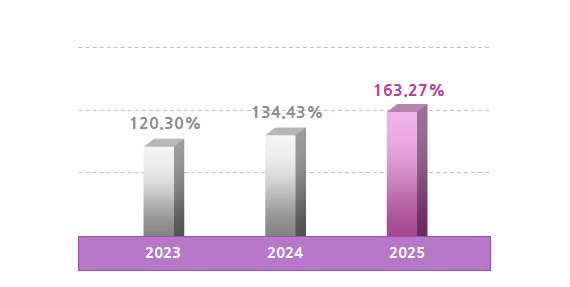
Debt ratio
-
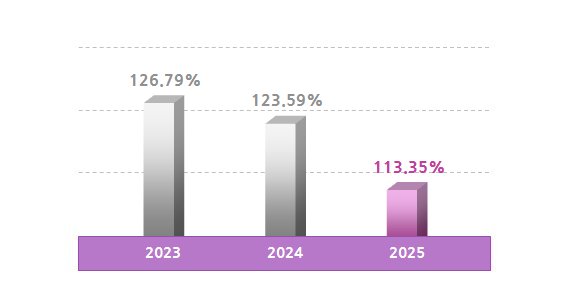
Current ratio
-
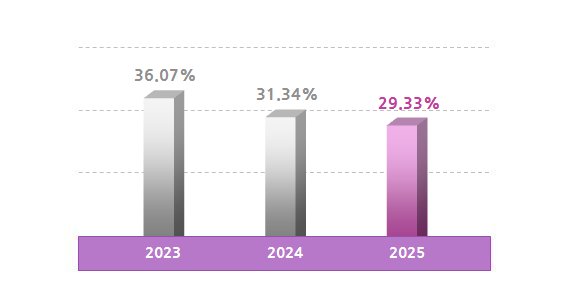
Total debts to total assets
-
Times interest earned ratio
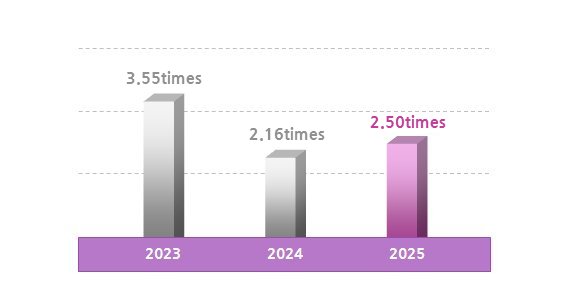
※ Based on Consolidated financial
-
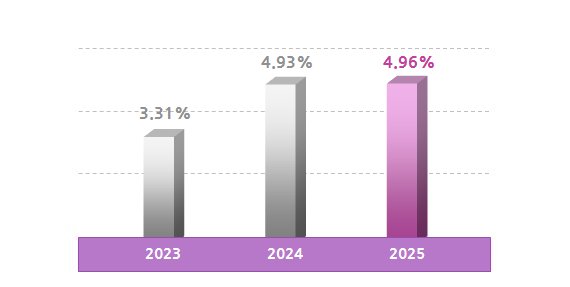
Operating profit margin
-
Net profit margin
-
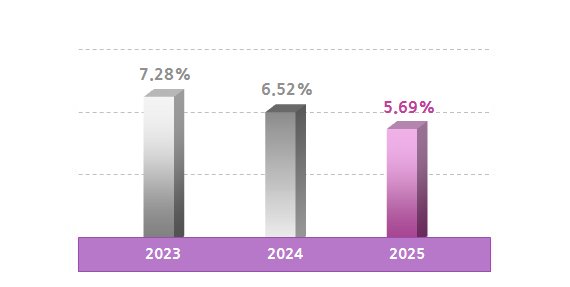
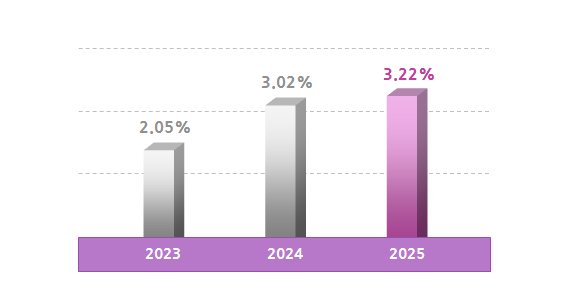
Net income to total assets ratio
-
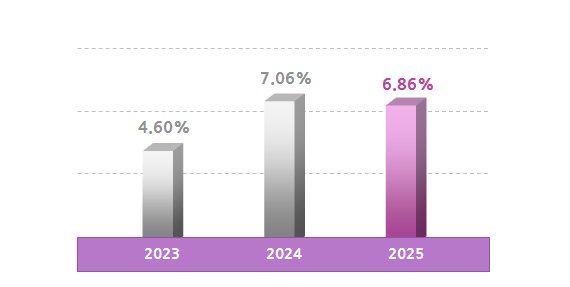
Return on equity
※ Based on Consolidated financial
-
% change in sales
-
% change in operating profit
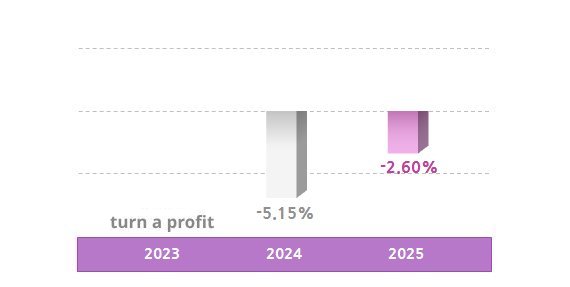
-
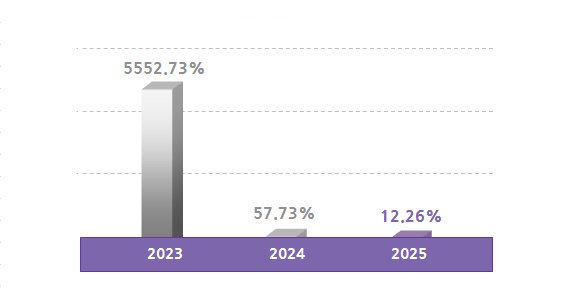
% change in net income
-
% change in total assets
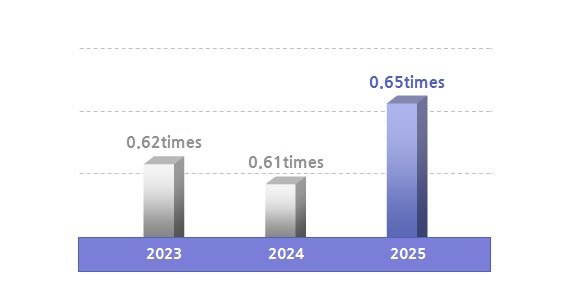
-
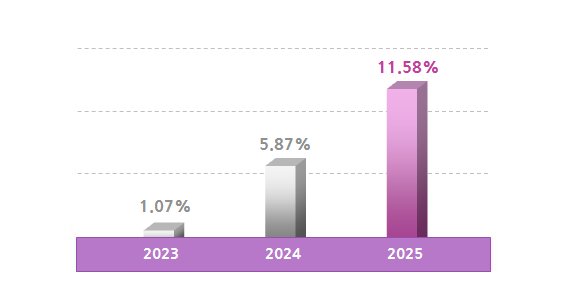
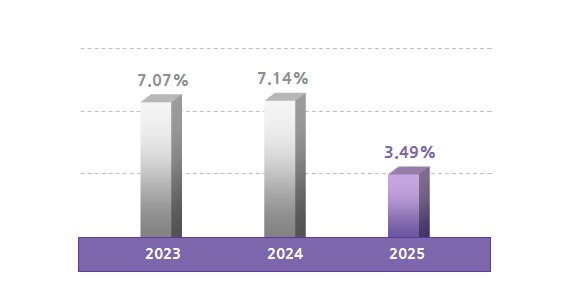
Asset turnover